File list
This special page shows all uploaded files.
| Date | Name | Thumbnail | Size | Description | Versions |
|---|---|---|---|---|---|
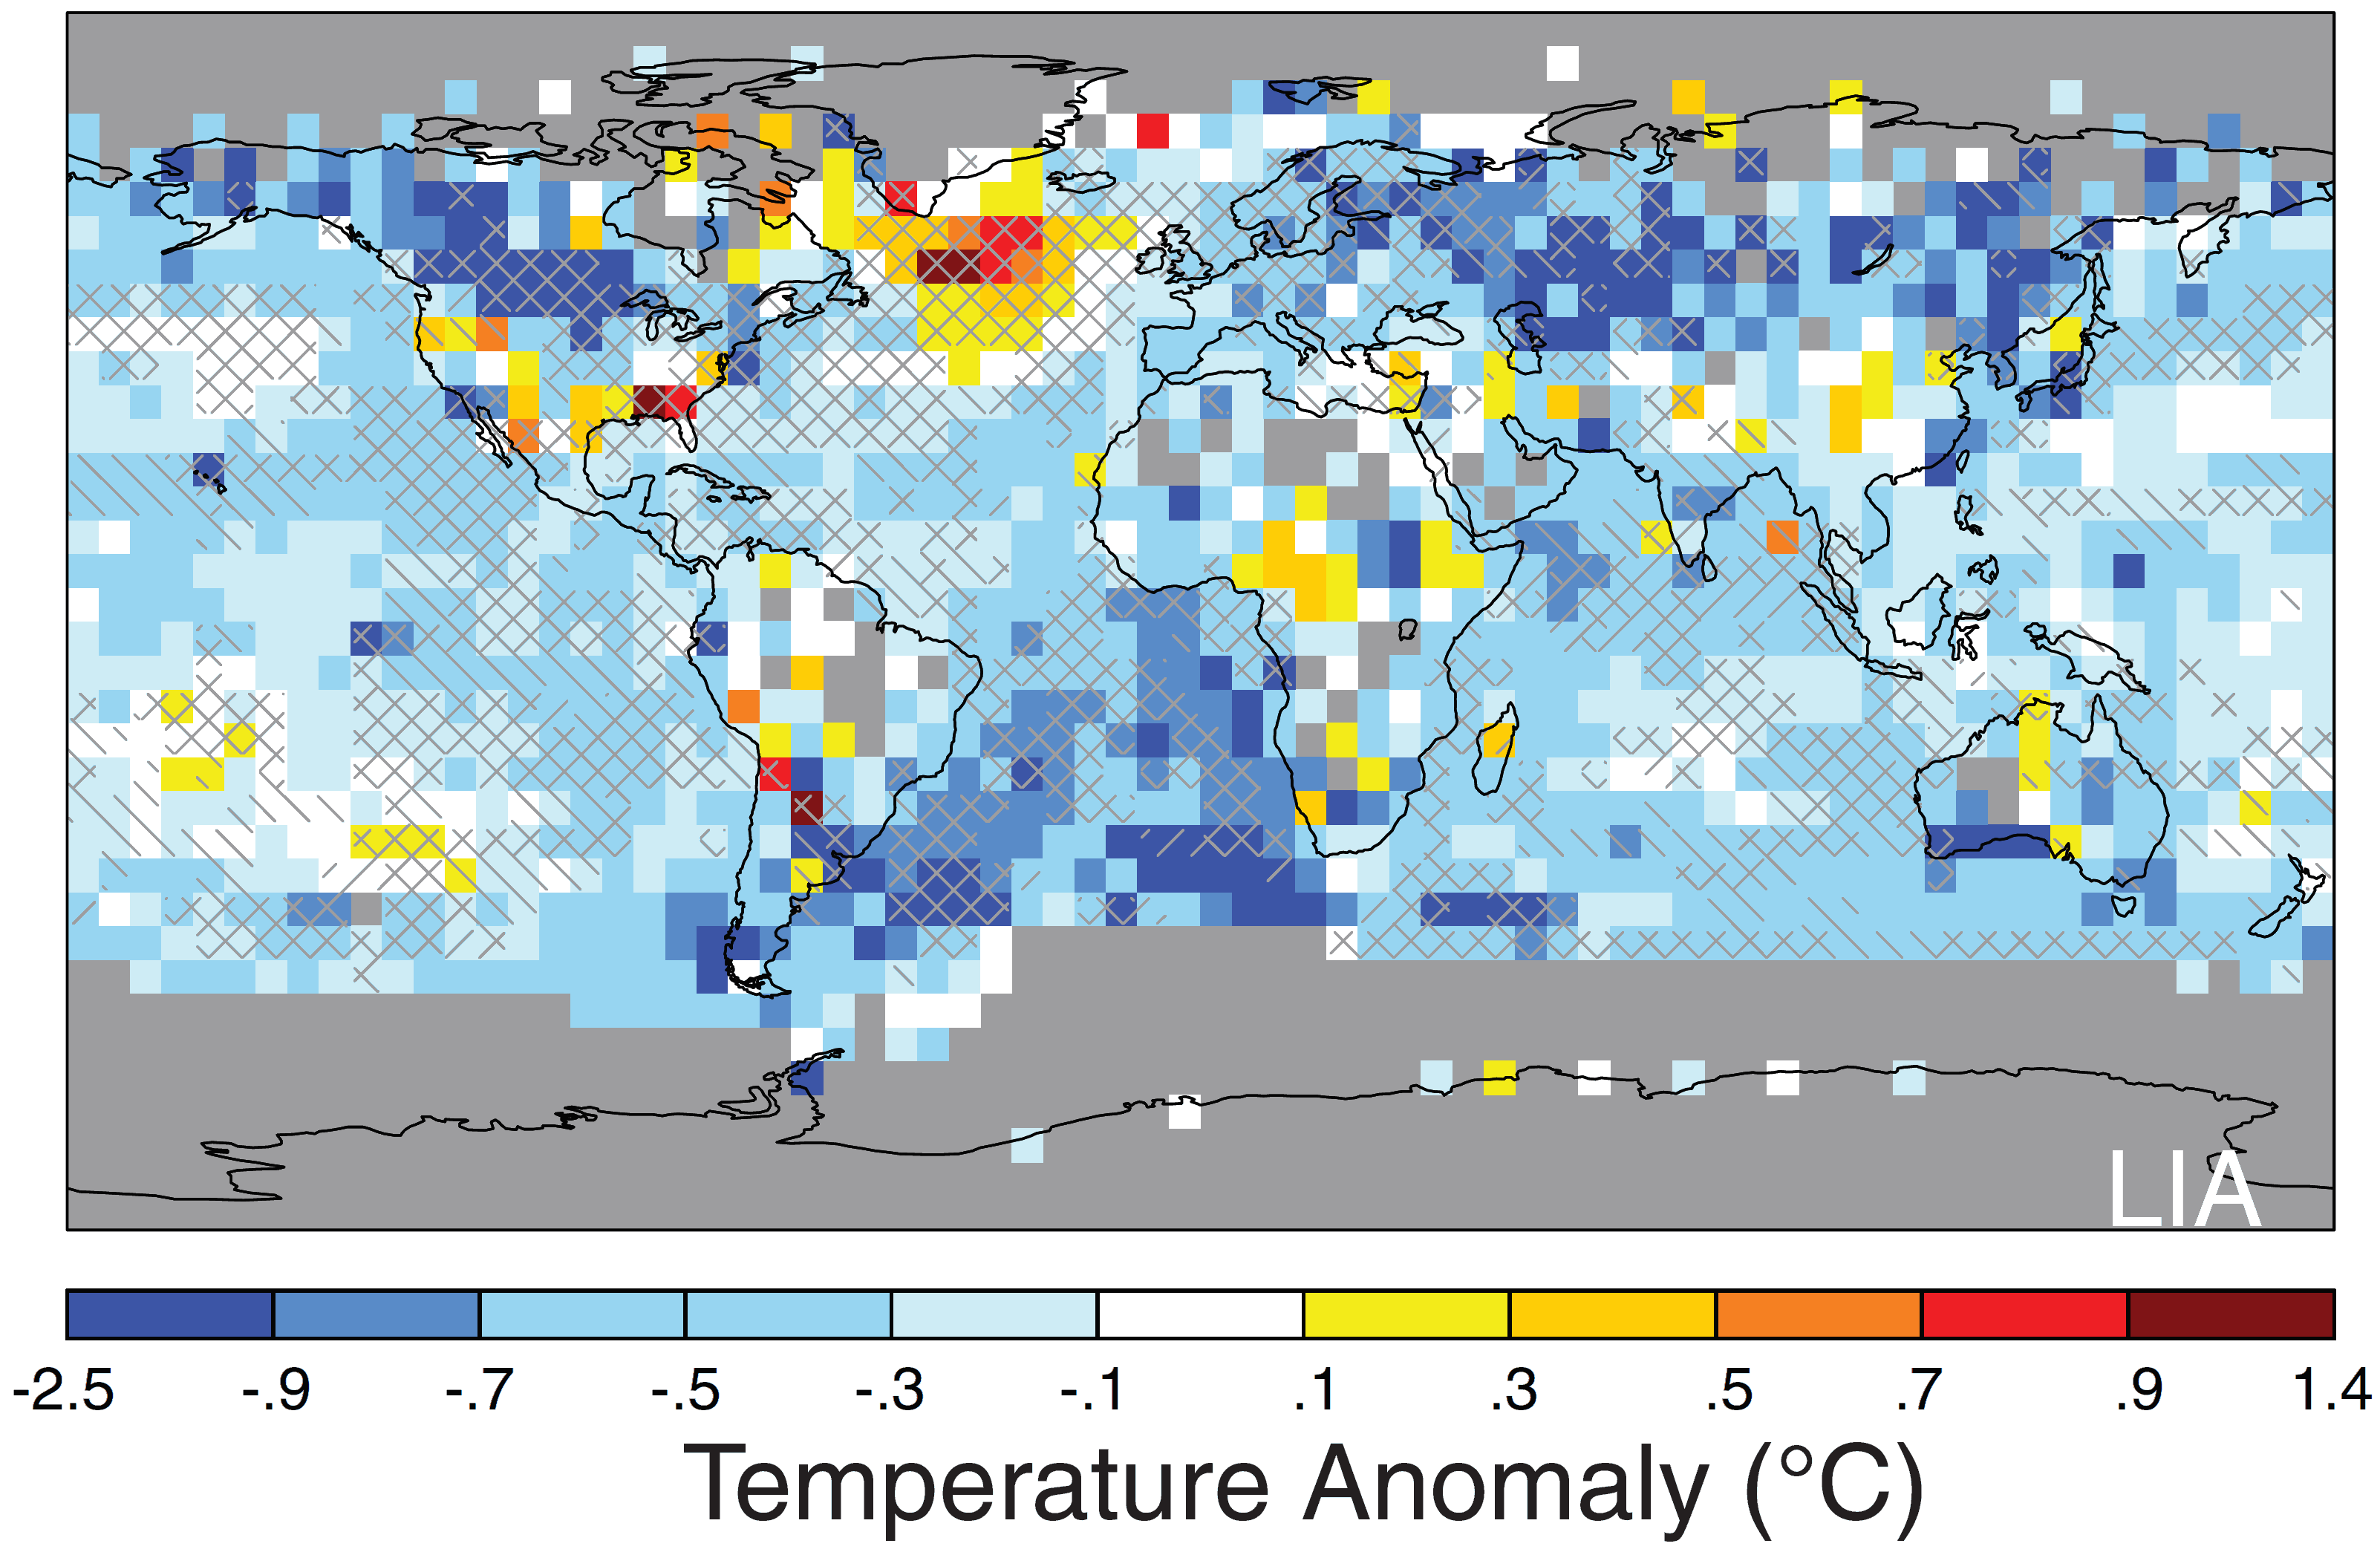
| 07:50, 10 January 2018 | MAP - World Global Average Surface Temperature Change during Little Ice Age (1400-1700 vs 1961-1990) (SCIENCE, Vol 326, 2009).png (file) | _(SCIENCE,_Vol_326,_2009).png) |
215 KB | MAP - World Global Average Surface Temperature Change during Little Ice Age (1400-1700 vs 1961-1990) (SCIENCE, Vol 326, 2009) | 1 |
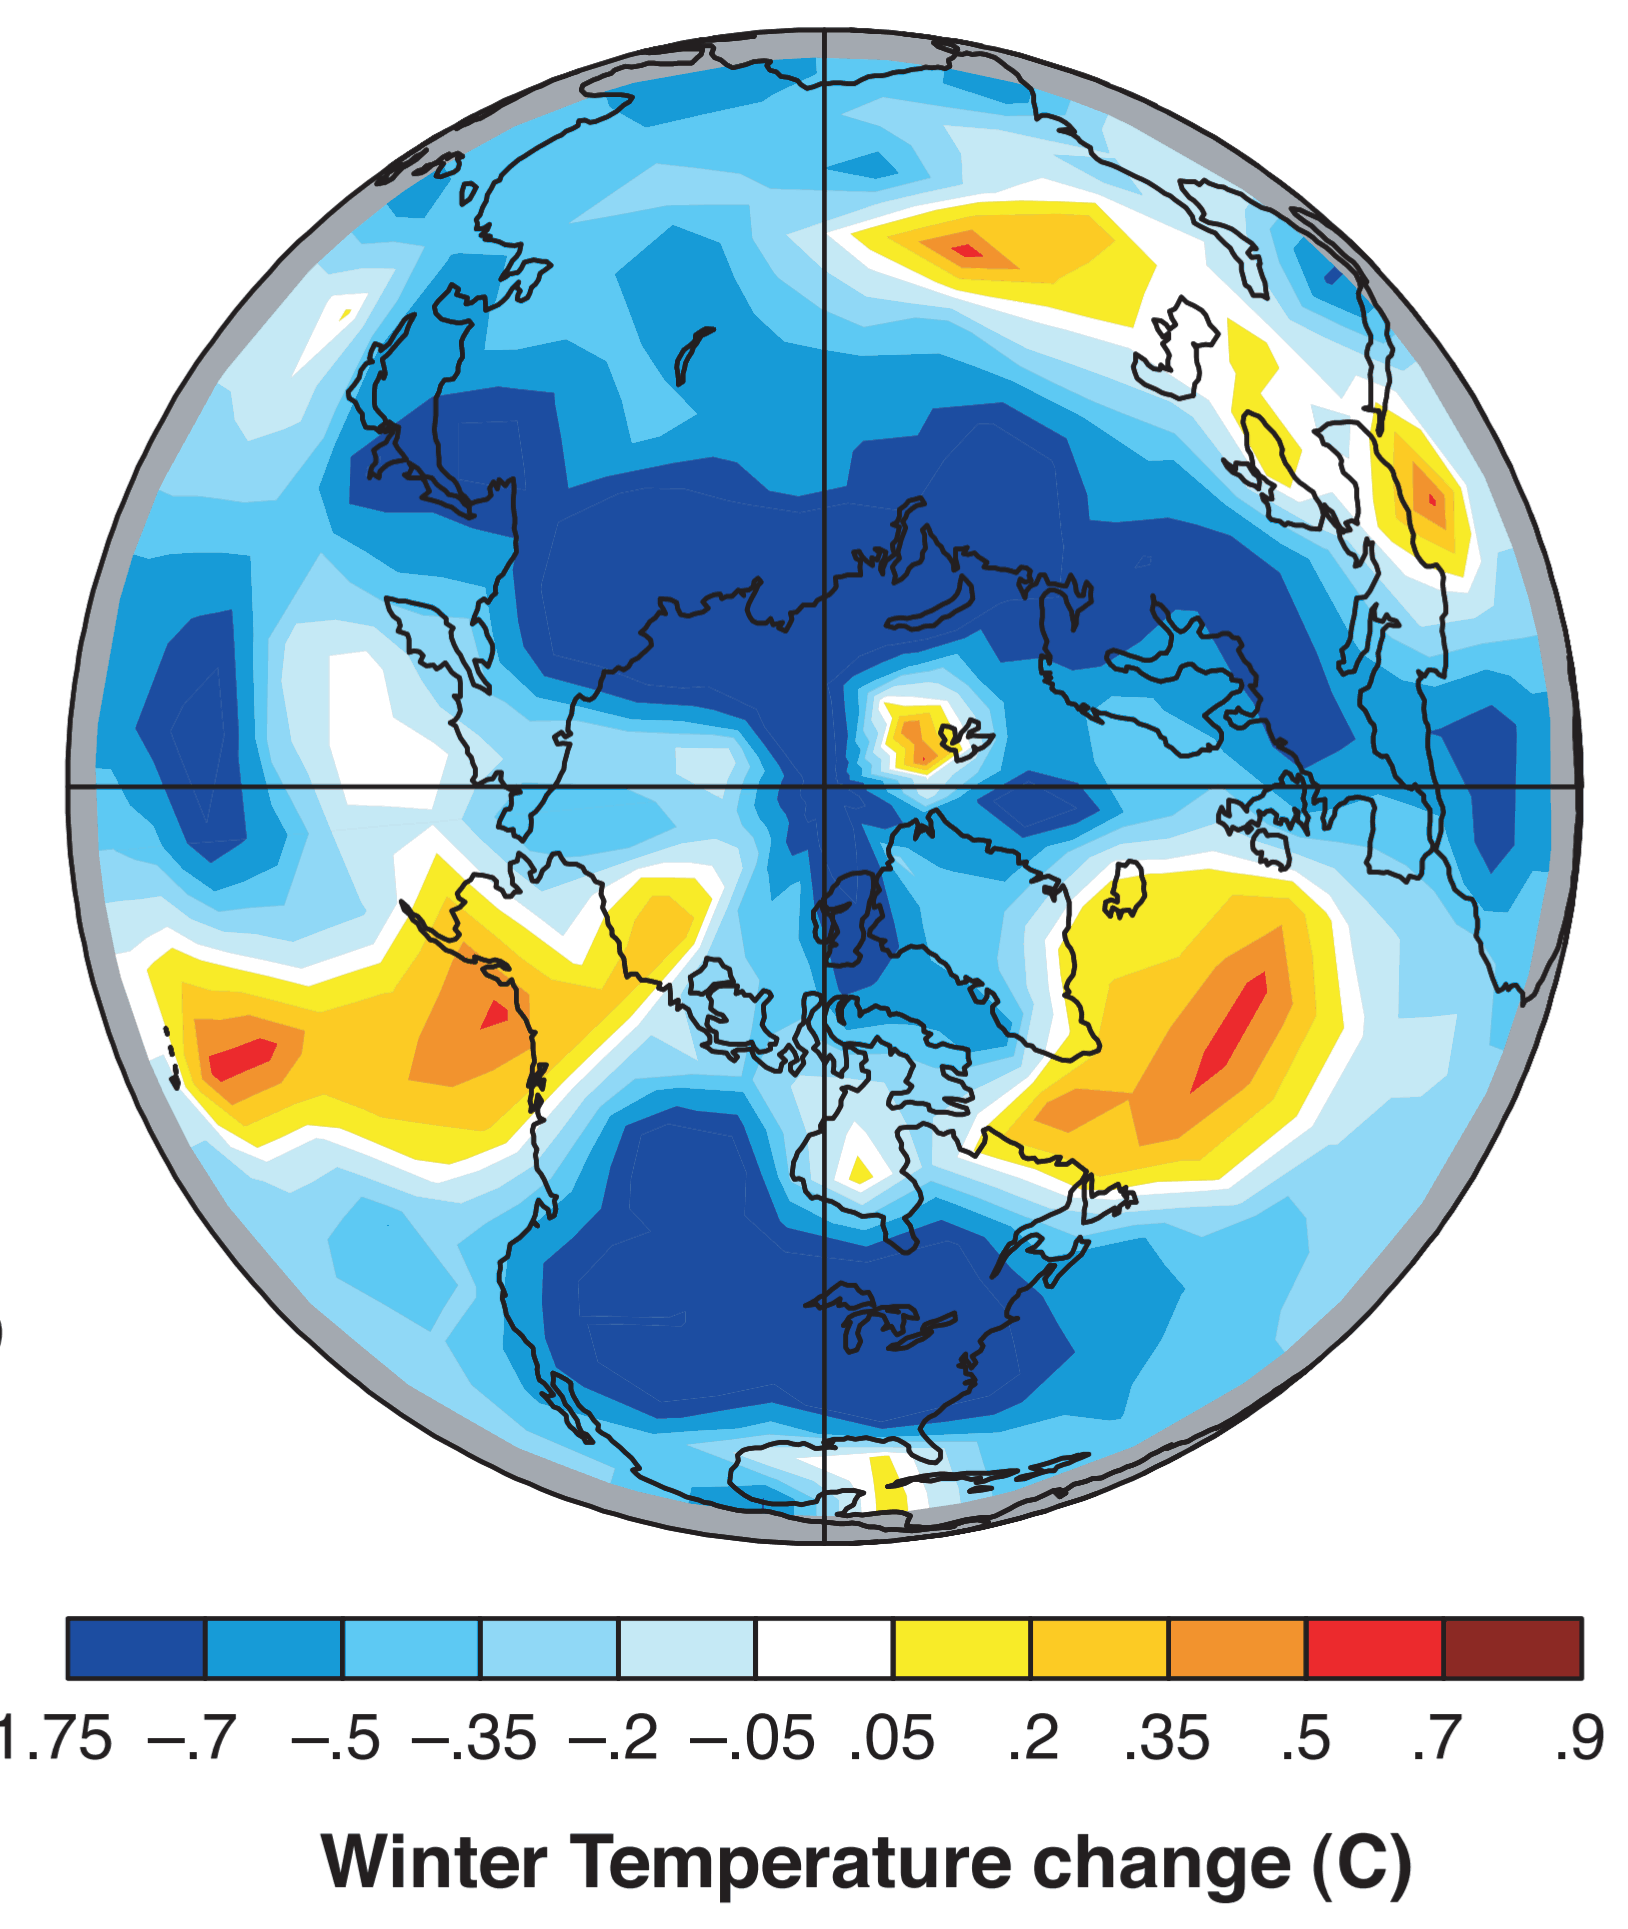
| 07:44, 10 January 2018 | MAP - World GCM model based Global Winter Temperature Change during Maunder Minimum (NASA GISS, 2001) .png (file) | _.png) |
170 KB | MAP - World GCM model based Global Winter Temperature Change during Maunder Minimum (NASA GISS, 2001) | 1 |
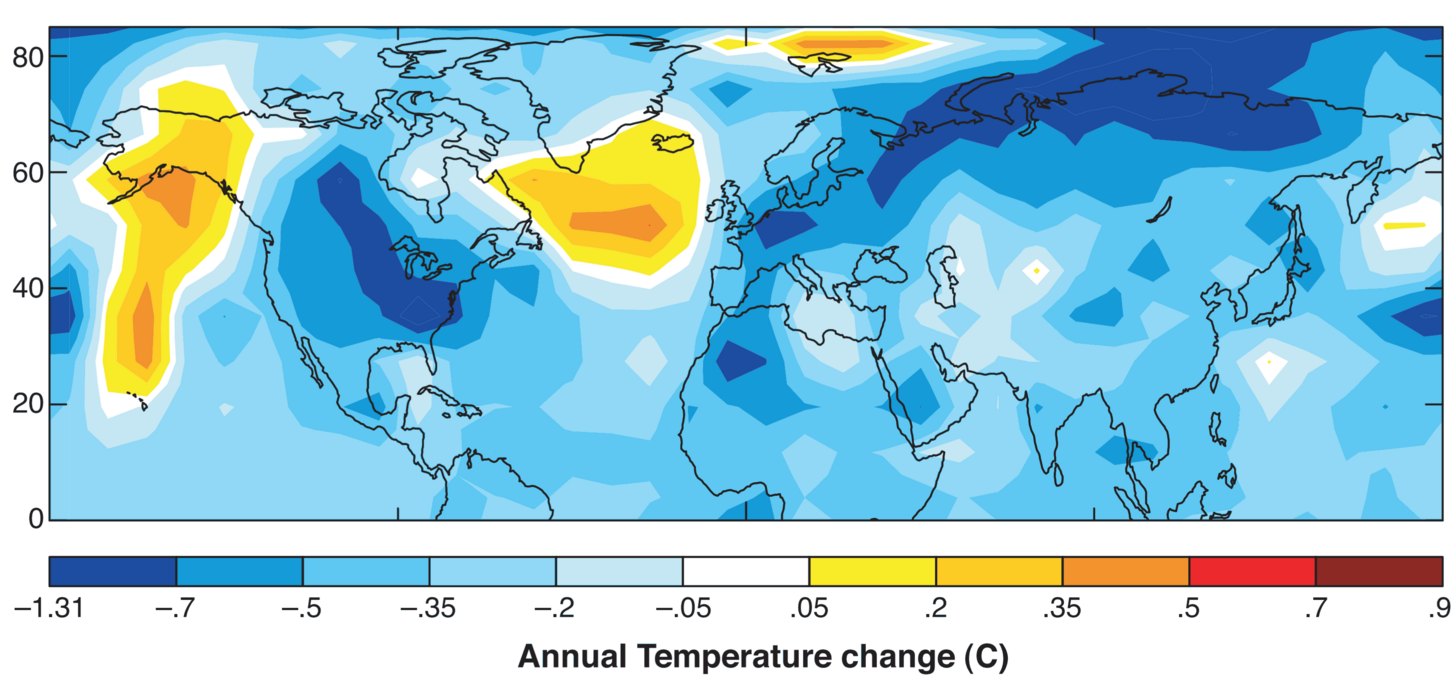
| 07:38, 10 January 2018 | MAP - World GCM model of Maunder Minum Temperature Change (NASA GISS, 2001).png (file) | .png) |
396 KB | World Map of GCM model based calculation of Maunder Minum Average Temperature Change (NASA GISS, 2001) | 1 |
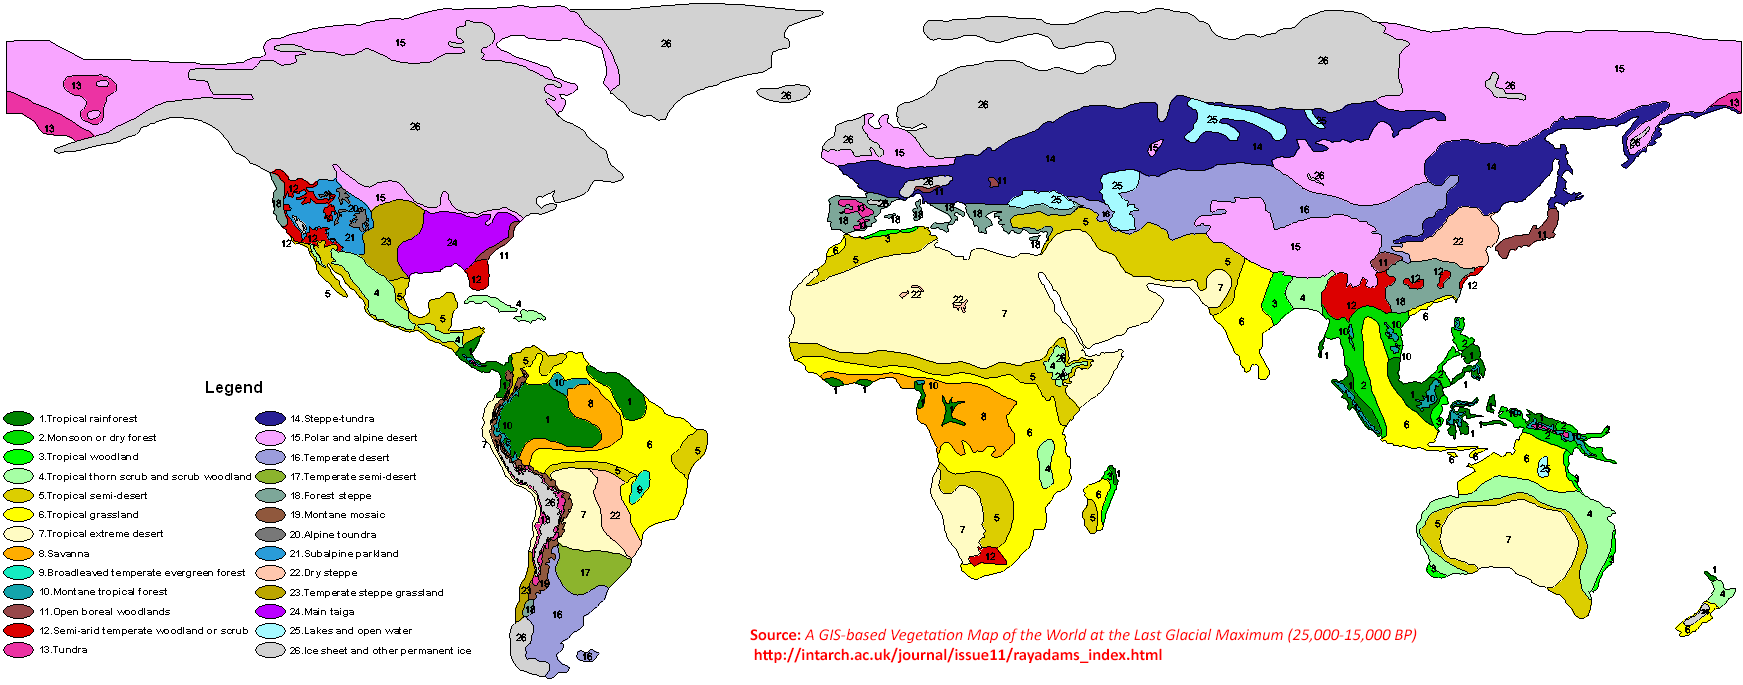
| 13:35, 6 January 2018 | Map - Global Last Glacial Maximum Vegetation Map with Ecosystem Type Classification v2 (2011).png (file) | .png) |
45 KB | Map - Global Last Glacial Maximum Vegetation Map with Ecosystem Type Classification v2 (2011) | 1 |
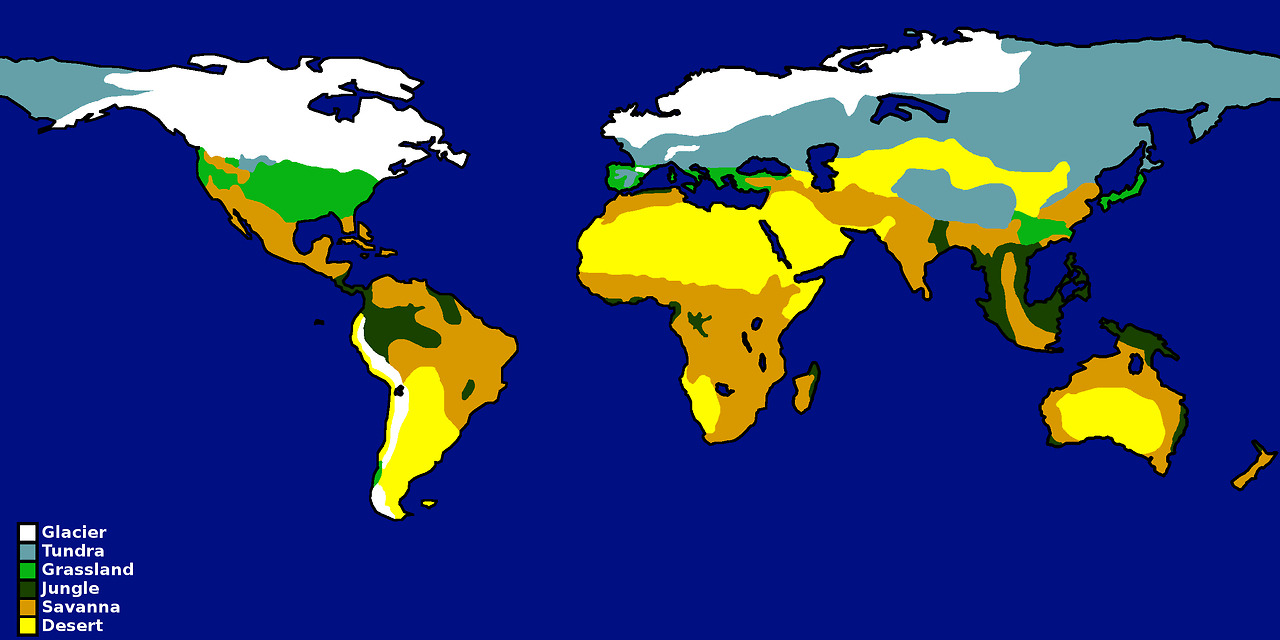
| 12:28, 6 January 2018 | MAP - World Map of the last Glacier, Tundra, Grassland, Jungle, Savanna & Desert Areas c. 20.000 Years Ago.png (file) |  |
415 KB | World Map of the last Glacier, Tundra, Grassland, Jungle, Savanna & Desert Areas c. 20.000 Years Ago (source unknown) | 1 |
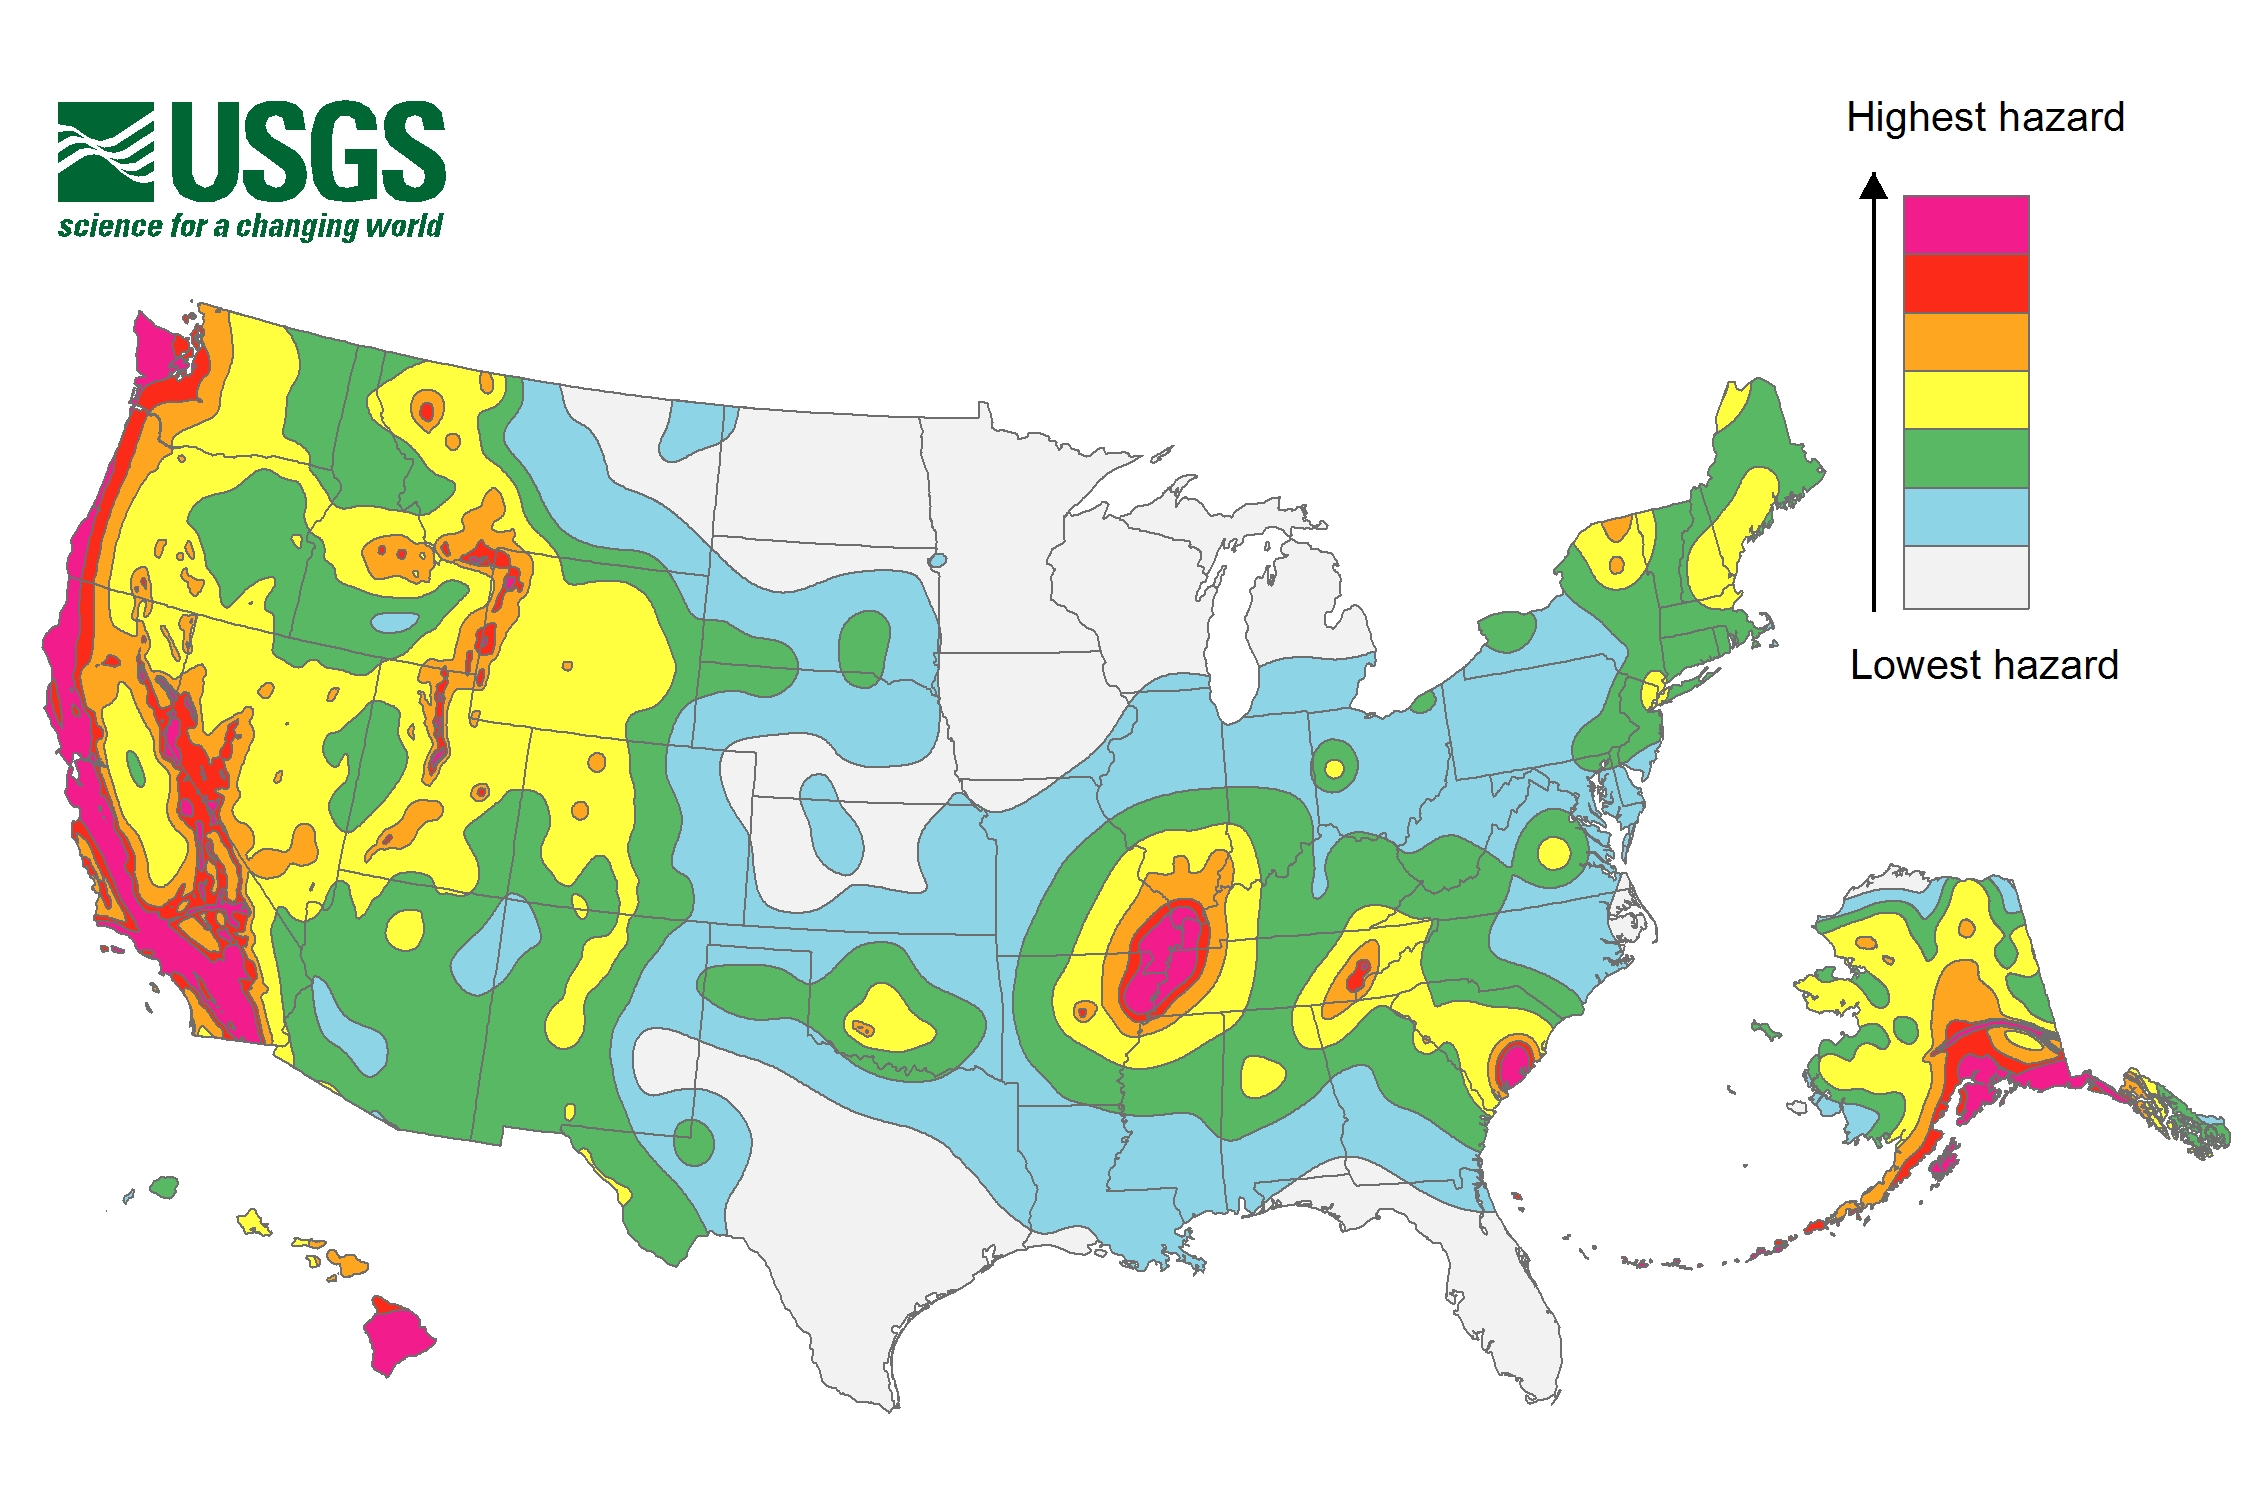
| 10:47, 4 January 2018 | MAP - USA Earthquake Hazard Map (USGS, 2014).jpg (file) | .jpg) |
947 KB | Earthquake Hazard Probability map (USGS, 2014) | 1 |
| 10:41, 4 January 2018 | World-Map-2016-Global-Cooling-Grand-Solar-Minimum-30N-and-45N-parallel-growing-zones.jpg (file) |  |
1.54 MB | 1 | |
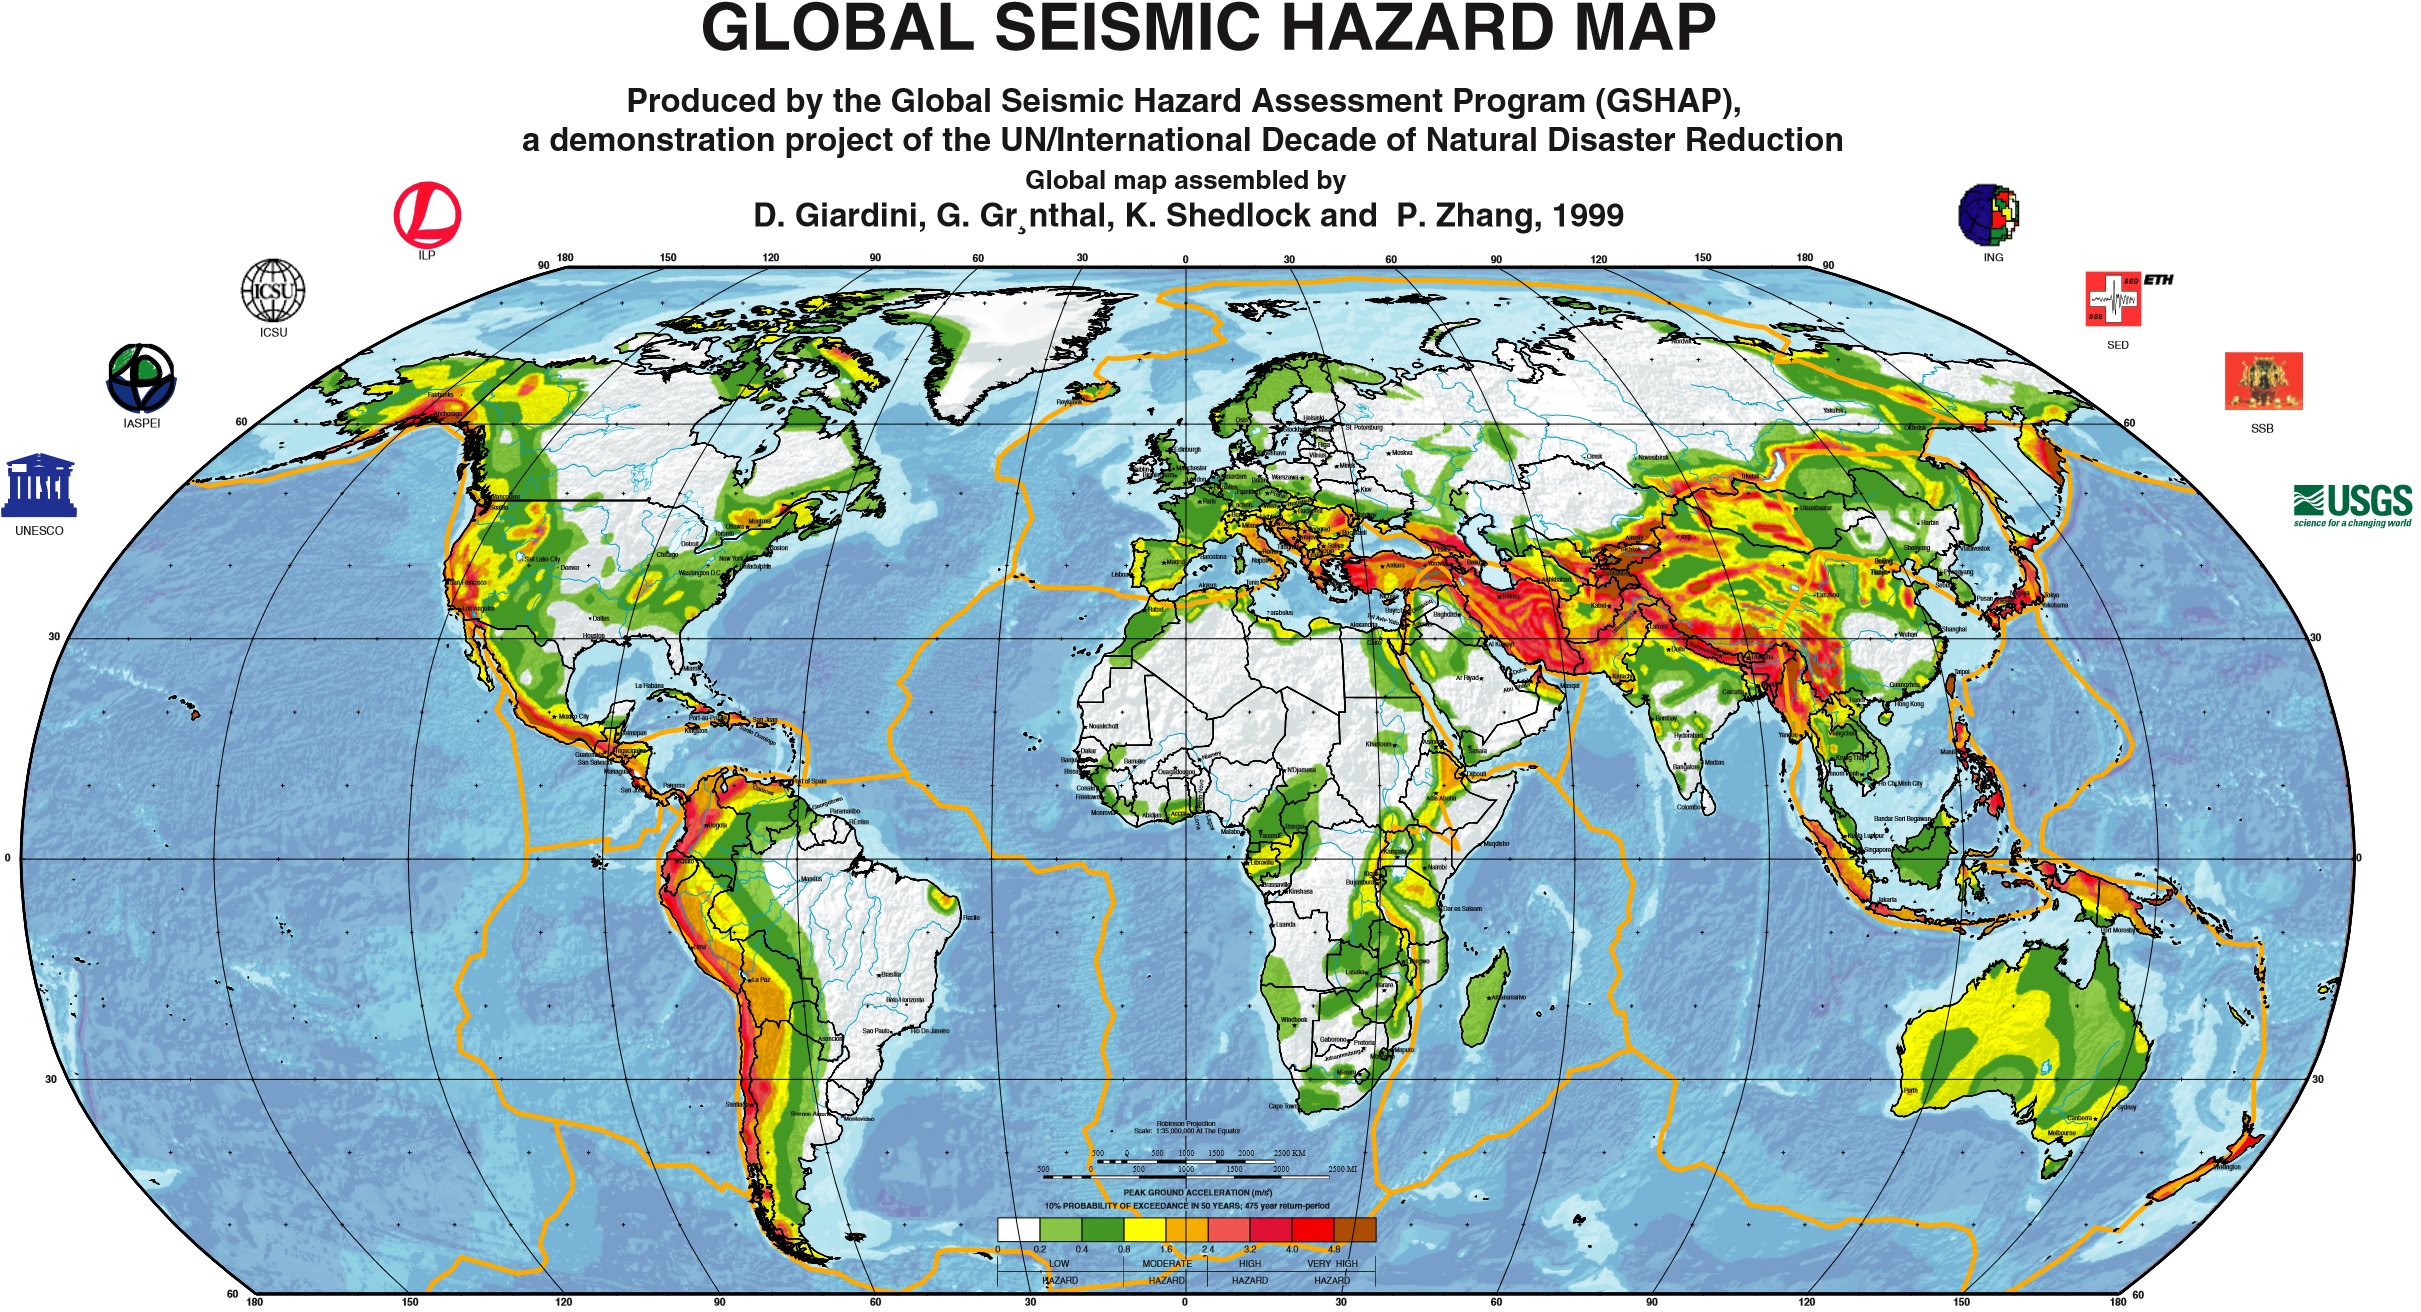
| 10:31, 4 January 2018 | MAP - Global Seismic Hazard Map (GSHAP, 1999).jpg (file) | .jpg) |
1.18 MB | Glomap Map of Seismic Hazards from Global Seismic Hazard Assessment Program (GSHAP), 1999. | 1 |
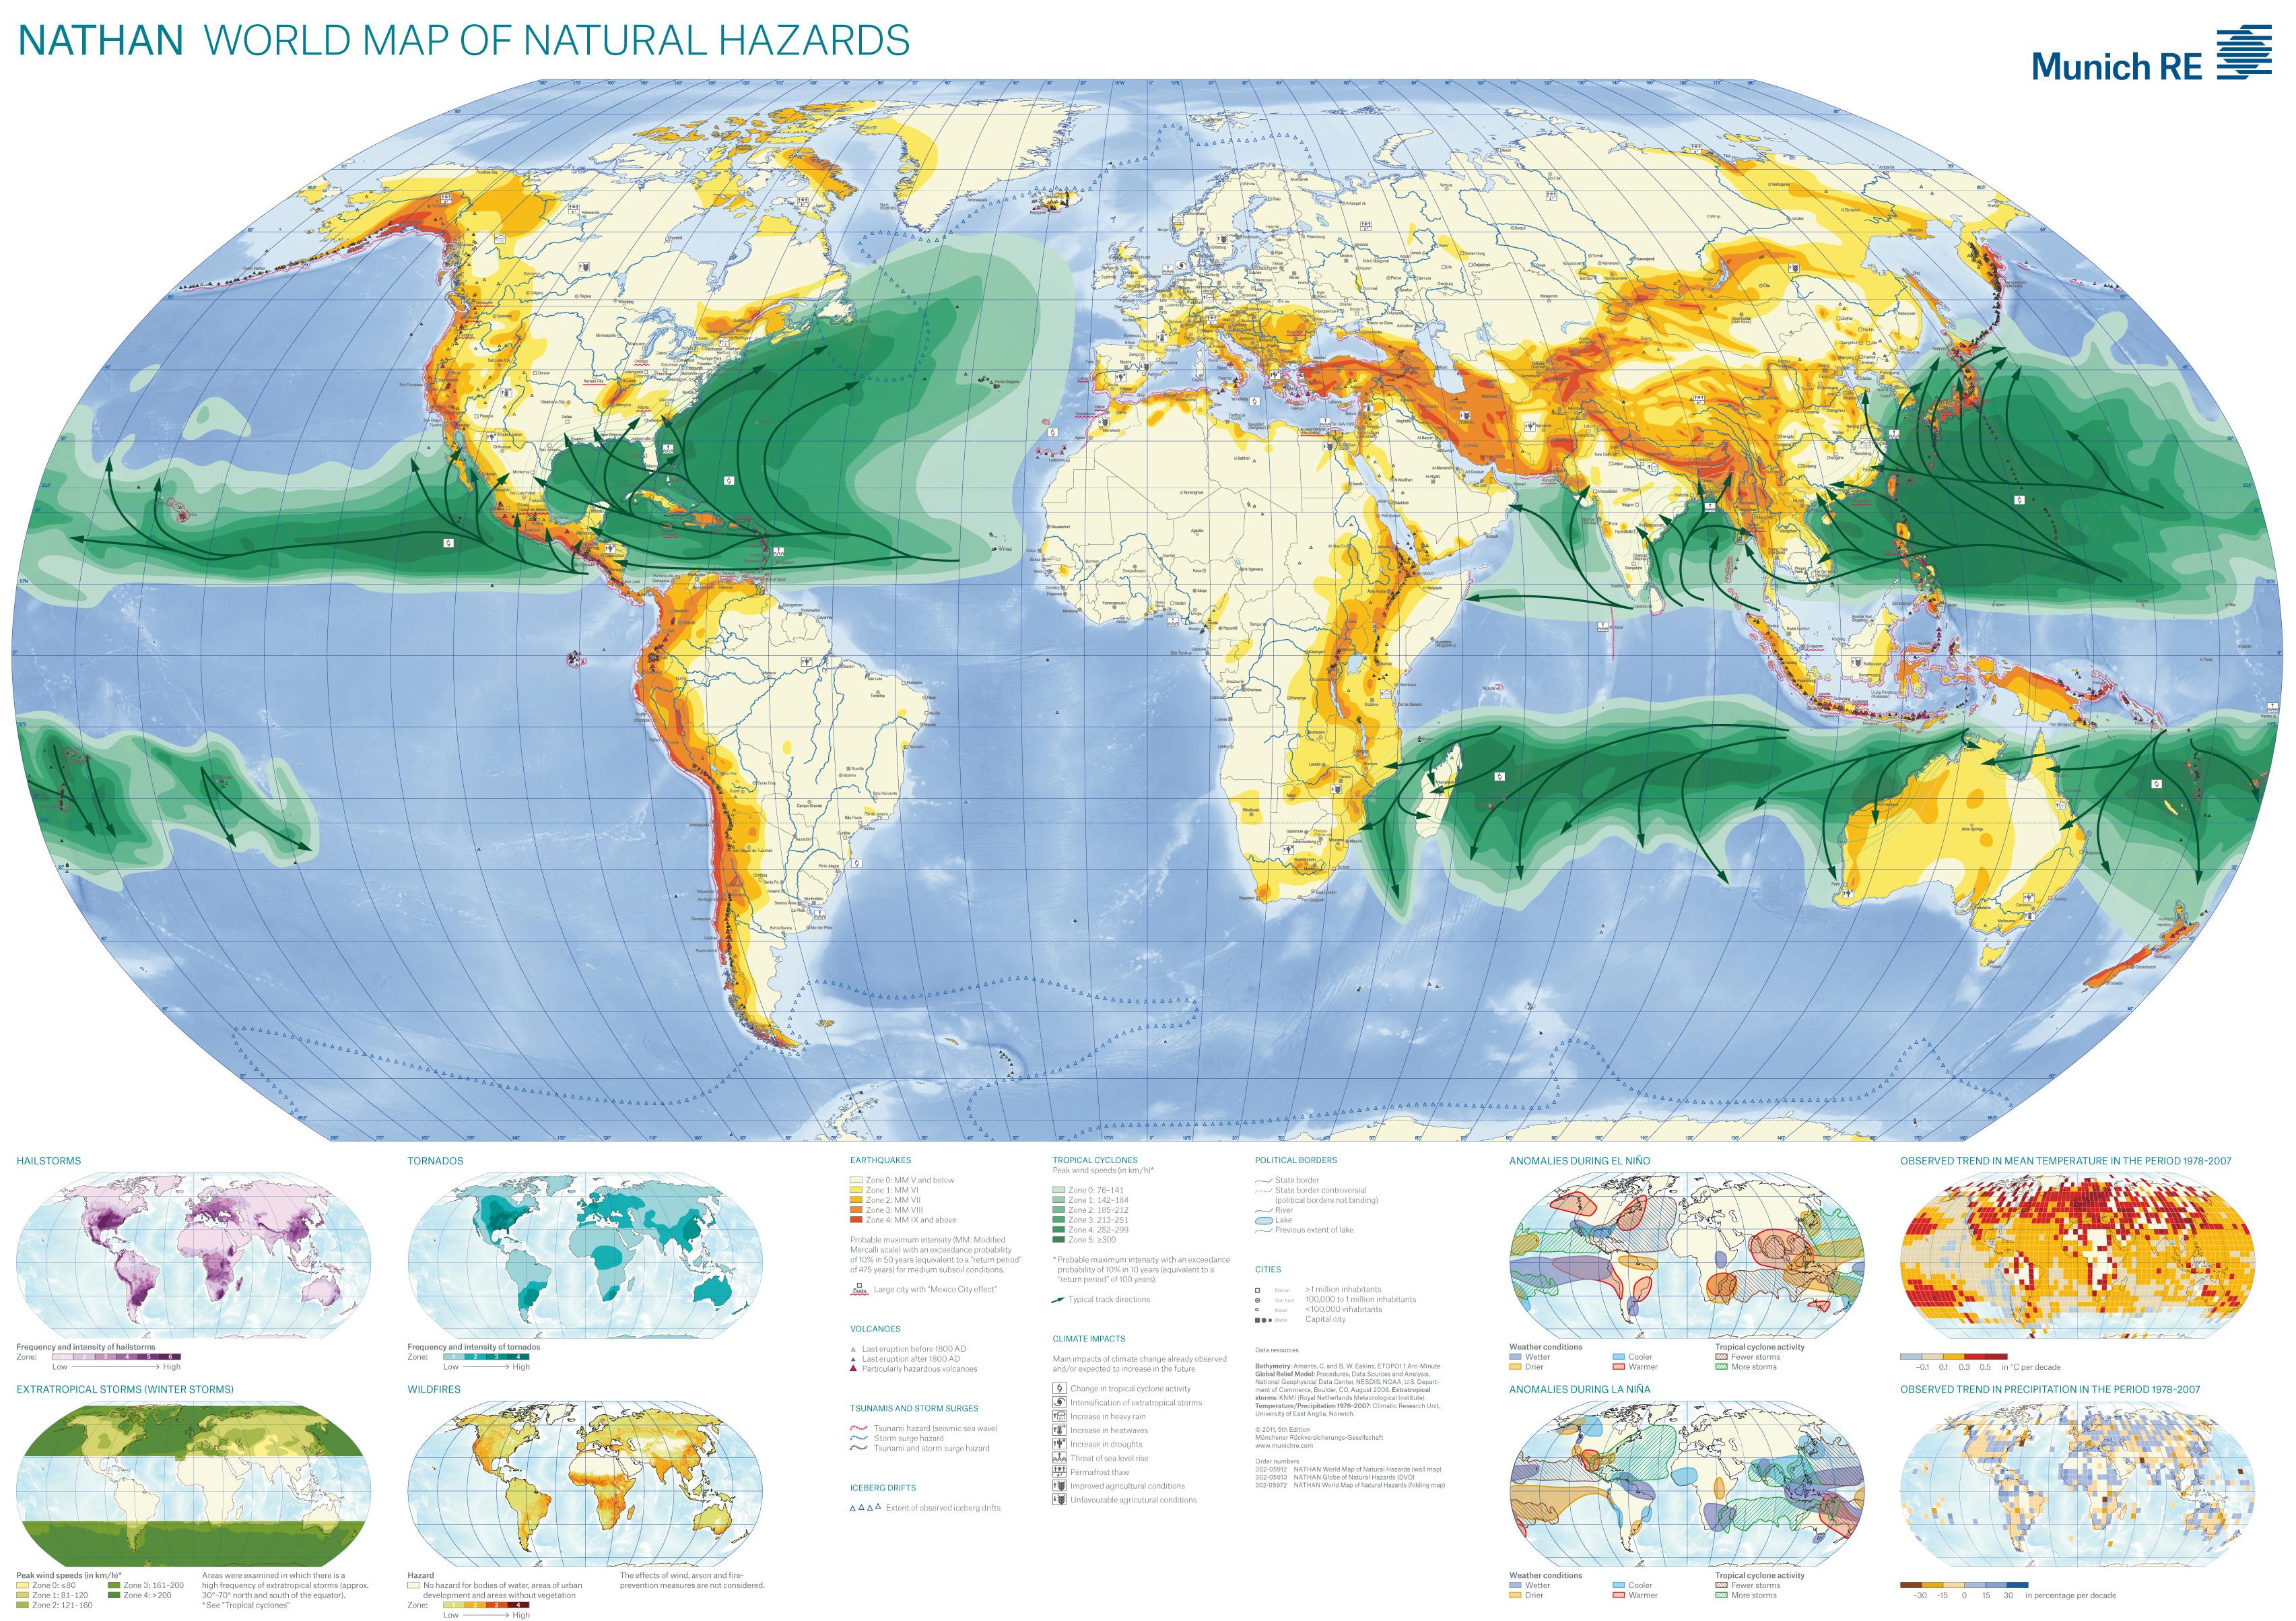
| 09:46, 4 January 2018 | MAP - World Map of Natural Hazards (Munic RE, 2011).jpg (file) | .jpg) |
1.14 MB | Hazards by type: Earthquakes, Tropical Cyclones, Volcanoes, etc Includes trends in precepitation, mean temperature, etc. Data only up to 2007 (later versions are part of expensive 'Nathan' Package, sold by the company Munich:RE) | 1 |
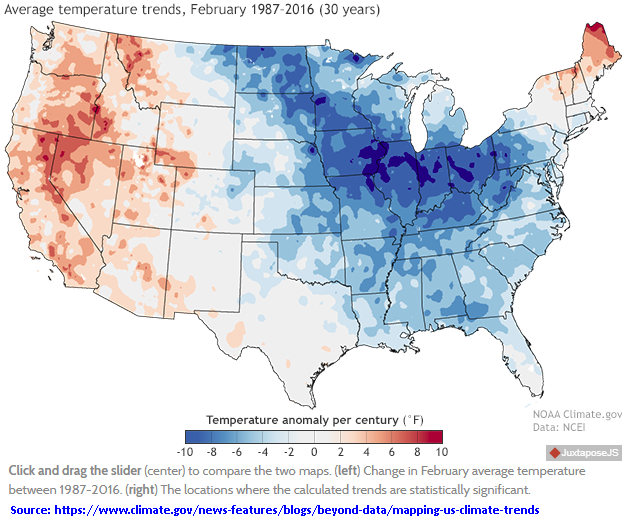
| 09:29, 4 January 2018 | MAP - USA Average Temperature Anomaly 1996-2016 (NOAA - NCEI, Climate.Gov) 12-2017.png (file) | _12-2017.png) |
243 KB | Average Temperature Trends, February 1987-2016 (30 Years). From: https://www.climate.gov/news-features/blogs/beyond-data/mapping-us-climate-trends | 1 |