File:MAP - USA Average Temperature Anomaly 1996-2016 (NOAA - NCEI, Climate.Gov) 12-2017.png
From Ice Age Farmer Wiki
No higher resolution available.
MAP_-_USA_Average_Temperature_Anomaly_1996-2016_(NOAA_-_NCEI,_Climate.Gov)_12-2017.png (639 × 527 pixels, file size: 243 KB, MIME type: image/png)
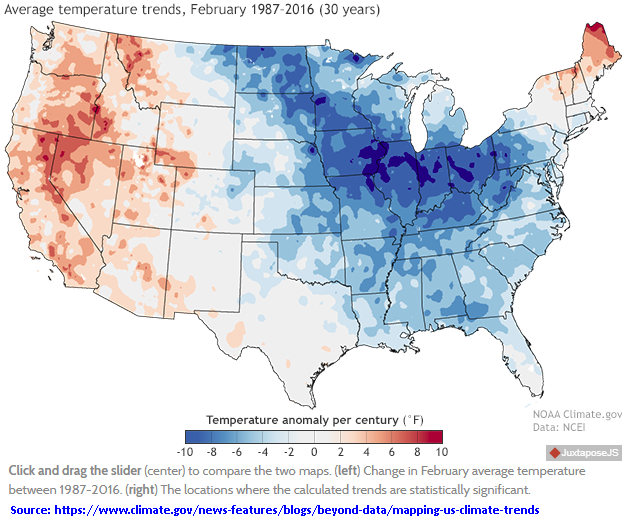
Average Temperature Trends, February 1987-2016 (30 Years). From: https://www.climate.gov/news-features/blogs/beyond-data/mapping-us-climate-trends
File history
Click on a date/time to view the file as it appeared at that time.
| Date/Time | Thumbnail | Dimensions | User | Comment | |
|---|---|---|---|---|---|
| current | 04:29, 4 January 2018 | | 639 × 527 (243 KB) | Nanomyou5 (talk | contribs) | Average Temperature Trends, February 1987-2016 (30 Years). From: https://www.climate.gov/news-features/blogs/beyond-data/mapping-us-climate-trends |
- You cannot overwrite this file.
File usage
The following page links to this file:
_12-2017.png&oldid=817)
_12-2017.png)
_12-2017.png&action=edit&redlink=1)
_12-2017.png&action=edit)
_12-2017.png&action=history)
_12-2017.png)
_12-2017.png)
_12-2017.png&oldid=817)
_12-2017.png&action=info)