Strategic Relocation: Maps
Contents
Climate
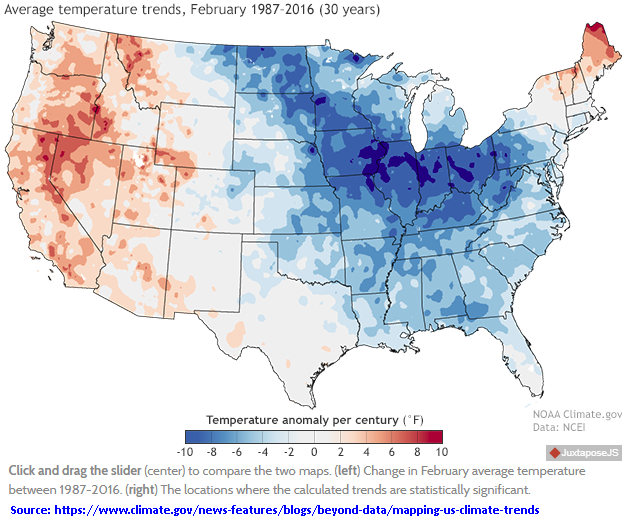
The following NOAA/NCEI Temperature Anomaly Map shows the trend in warming / cooling for the past 30 years (1987-2016). This should be enough of a time to see the potential geographical distribution of cooling in the USA, although it may not fully reflect the actual results of a grand solar minimum changes by geographical location.
Source: https://www.climate.gov/news-features/blogs/beyond-data/mapping-us-climate-trends
- Wind map although, again, per Grand Solar Minimum Symptoms, expect it to be windier, definitely potential for gusty storms
Risk Maps
Flooding
See FEMA's Flood Map Service Center
Population


Evolving mega cities:

Tornado
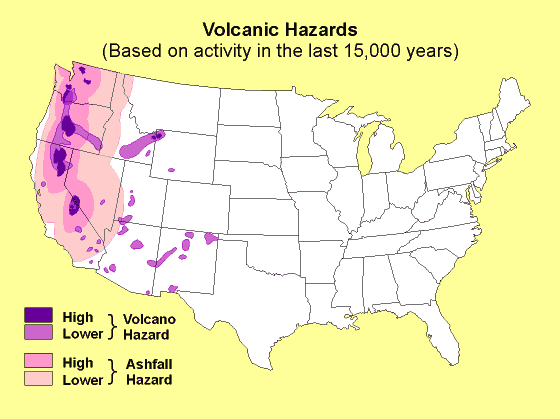
Volcano

Resource Maps
Water
The following USGS website, Real-Time Groundwater Data, lists many locations within each state and the approximate depth to which you may have to drill to reach groundwater. A few extreme depths are located in parts of Nevada at depths greater than 800 feet while other locations are only 10’s of feet.
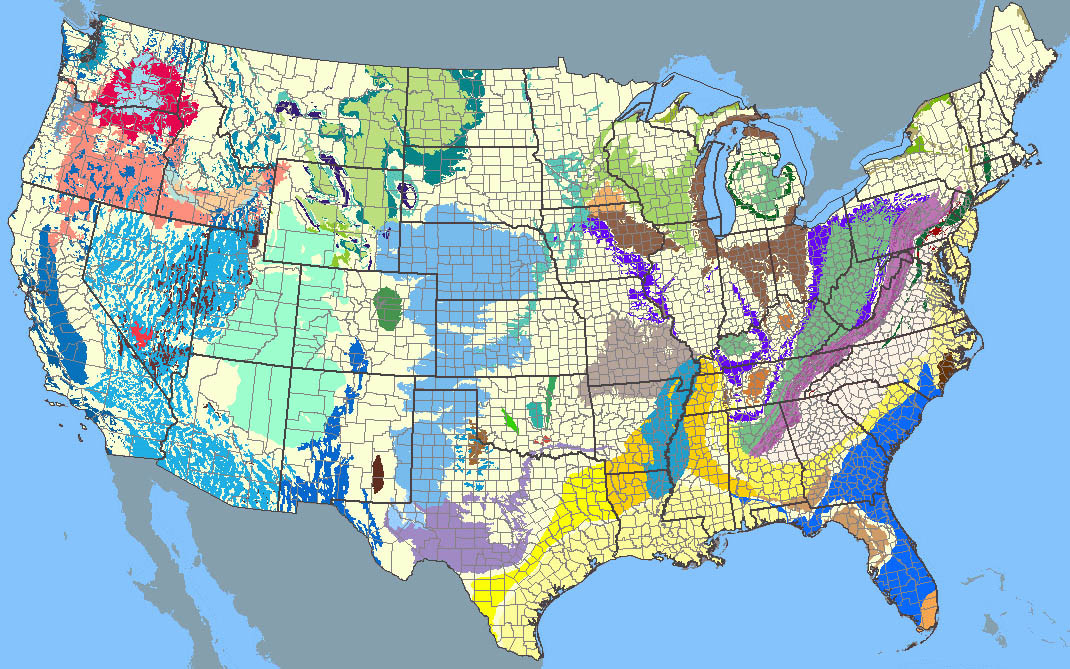
The following map shows the location of all the aquifers of the United States. If you are choosing a ‘retreat’ relocation, you may find it desirable to live as close as possible to a good water source, or above an aquifer – as water becomes more of a valuable commodity in our future.

Note: What these maps depict are major aquifer systems. However, there are literally tens of thousands of wells in areas not marked that are suitable for domestic water requirements – capable of producing several gallons per minute. These are shallower system dependent upon the local geology. If there is enough water to support surface streams throughout most of the year – then there is a shallow aquifer system most likely associated with it that can be used. Point of caution is to make sure your sewage is disposed of down hill/ down gradient of your well to avoid pulling the effluent into your water supply.
